Why Investors Ignore Most BRSR Data, and How to File the Kind They Read
Reporting
PS Team
September 3, 2026
Table of Contents

If you spend months on your BRSR and investors never mention it, the problem may not be your effort.
It may be the information itself.
A number without context is difficult to use.
An investor opens your BRSR looking for something specific:
A risk.
A trend.
A number moving in the wrong direction.
A target being missed.
Something they can compare with another company.
When they reach your numbers and find figures that are rounded, missing a denominator, reported for only one year, or presented without a target, the report may have met its disclosure requirement.
But there is little for an investor to act on.
And information that cannot be compared is easy to skip.
So what does an investor actually want to see in your BRSR?
Not more information.
Better information.
Investors read BRSR to understand risk
An investor is trying to understand your business, its risks, its performance and where it is heading.
BRSR adds another layer to that picture.
It provides information on areas such as:
- Environmental performance
- Employee and workplace practices
- Resource consumption
- Supply-chain risks
- Governance
- Safety
- Regulatory exposure
- Progress against sustainability targets
But investors do not have unlimited time to study every page.
They scan.
They compare.
They look for changes.
A sudden rise in workplace incidents matters.
A jump in emissions intensity matters.
A spike in employee attrition matters.
A target missed repeatedly matters.
A policy statement on its own tells them much less.
That is why the quality of a number matters as much as its presence.
The problem with boilerplate
Consider these statements:
"We are committed to sustainability."
"We comply with all applicable laws."
"We conduct regular training."
"We have policies covering human rights."
These statements might all be true.
But they are difficult to compare.
Five companies in the same sector can write almost identical sentences.
So what does an analyst learn?
Very little.
The problem is not the statement.
It is the absence of evidence around it.
Instead of:
"We conduct regular safety training."
Show:
- Employees covered
- Training hours
- Coverage percentage
- Previous-year comparison
- Relevant safety outcomes
Instead of:
"We are committed to reducing emissions."
Show:
- Current emissions
- Emissions intensity
- Previous-year performance
- Base year
- Target
- Target year
- Progress to date
Now the investor has something to work with.
The disclosure becomes measurable.
And measurable information is much easier to compare.
A number without context cannot tell the full story
Take this disclosure:
Emissions: 4,20,000 tonnes CO₂e
Illustrative example.
It is a number.
But is it high?
Is it falling?
Is it increasing?
Is the company performing better than its peers?
Is the company on track to meet its target?
On its own, the number answers none of these questions.
Now add some context:
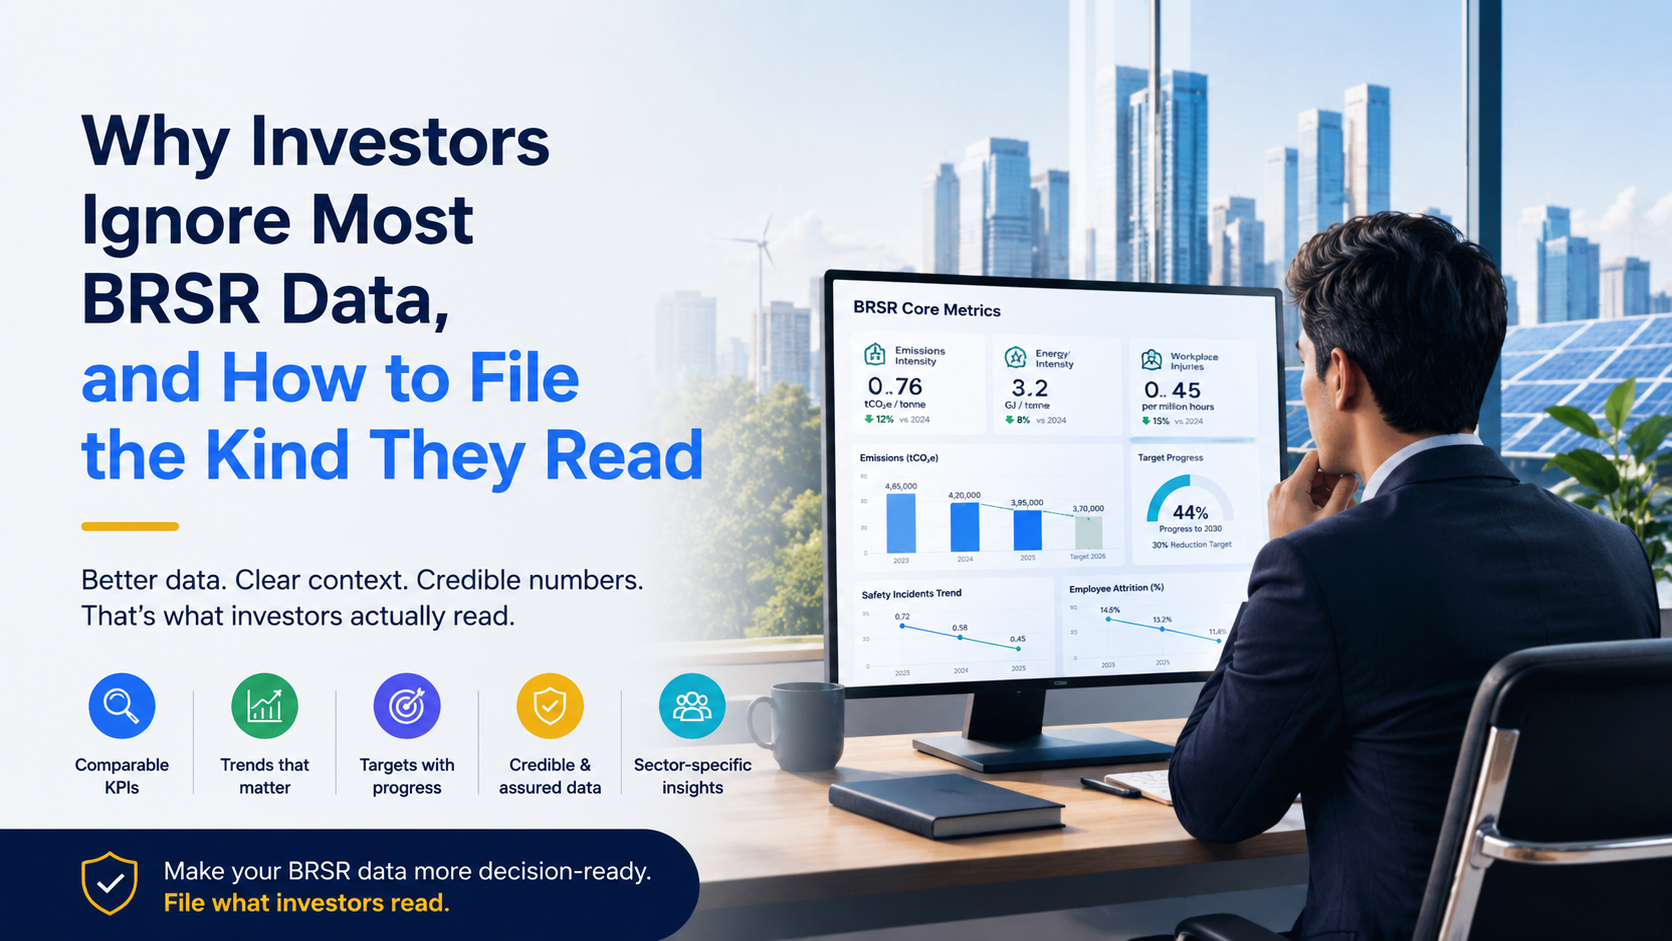
- 2024: 4,20,000 tCO₂e
- 2025: 3,95,000 tCO₂e
- 2026 target: 3,70,000 tCO₂e
Illustrative example.
The direction is now visible.
You can see the reduction.
You can see the target.
You can see the remaining gap.
Or perhaps intensity tells the story better:
- 2024: 0.82 tCO₂e per tonne
- 2025: 0.76 tCO₂e per tonne
- 2030 target: 0.55 tCO₂e per tonne
Illustrative example.
Now the investor has another important piece of information.
Performance relative to business activity.
That is where the denominator matters.
The denominator often tells the real story
Absolute numbers can give an incomplete picture.
Suppose a manufacturer increases production by 20%.
Its total emissions increase by 5%.
At first glance, emissions have gone up.
But emissions per tonne of product have fallen.
That tells a different story.
The right denominator depends on the business.
It might be:
- Emissions per tonne of product
- Energy per unit of production
- Water per unit of output
- Waste per unit of output
- Emissions per unit of revenue
- Safety incidents per working-hour base
The important question is:
Which number helps someone understand how this business is performing?
That is a better question than:
What ESG numbers do we have?
Sector-specific data beats generic ESG claims
An investor does not evaluate a cement company in the same way as a bank.
The risks are different.
The operating model is different.
The numbers that matter are different.
For a cement company
Relevant indicators could include:
- Clinker-to-cement ratio
- Energy consumption per tonne
- Alternative fuel usage
- Emissions intensity
- Water consumption
- Waste utilisation
For a bank or NBFC
Relevant indicators could include:
- Exposure to high-emitting sectors
- Financed emissions
- Climate-related financial exposure
- Responsible-lending indicators
For an apparel company
Relevant indicators could include:
- Water intensity
- Energy use
- Supplier assessments
- Labour practices
- Worker safety
- Supply-chain compliance
The test is simple:
Would an analyst covering my sector recognise this number as relevant to the business?
If not, ask why you are highlighting it.
Do not fill a BRSR with impressive-looking metrics.
Choose the numbers that explain your actual business, risks and performance.
Investors need trends, not isolated numbers
One year's number tells you where you were.
A trend tells you where you are going.
Compare these two examples:
- 2024: 12.5%
- 2025: 14.2%
- 2026: 16.1%
Versus:
- 2024: 12.5%
- 2025: 12.7%
- 2026: 12.9%
Illustrative examples.
The direction becomes obvious.
This is why historical data matters.
Where relevant, give investors enough history to understand the direction of travel.
Then show the target.
Then explain the gap.
That makes the disclosure much more useful.
Targets only matter when progress is visible
"We aim to reduce emissions by 30%."
Sounds good.
But an investor immediately has more questions.
30% from what?
By when?
Compared with which base year?
How much has already been achieved?
Is the company on track?
A stronger disclosure connects the pieces:
- Base year: 2022
- Reduction target: 30%
- Target year: 2030
- Reduction achieved to date: 11%
- Reduction achieved this year: 3%
Illustrative example.
Now an investor has a basis for evaluating progress.
The same principle applies to other sustainability targets.
A target without a baseline is difficult to judge.
A target without progress is difficult to track.
A target without a timeline is difficult to evaluate.
Credibility: say what sits behind the number
Investors also need to understand how the number was produced and what level of external review it has received.
This is one reason SEBI introduced BRSR Core.
BRSR Core is a defined set of key ESG performance indicators designed to improve the reliability and comparability of important ESG disclosures. SEBI initially introduced a glide path covering the top 150 listed entities from FY 2023-24 and extending to the top 1,000 by FY 2026-27.
The framework has since evolved.
The practical lesson is simple.
Tell the reader what sits behind the number.
If a figure has been assessed or assured, say so.
If it is based on management estimates, say so.
If assumptions were used, document them.
If the methodology changed, explain why.
If the data has limitations, disclose them.
Do not make investors reverse-engineer your numbers.
Your data process matters too
A strong BRSR number needs more than a formula.
Someone needs to own the data.
Someone needs to review it.
Someone needs to approve it.
And your team needs to be able to show where the number came from.
This is where data governance becomes important.
For example, a strong workflow should allow you to trace:
Source → Data entry → Review → Approval → Reported figure
If an investor, auditor or assurance provider asks:
"Where did this number come from?"
your team should not have to search through emails and spreadsheets to find the answer.
The evidence should already be organised.
Karbon is designed around this type of workflow, with maker-checker-approver controls and configurable approval levels. Where required, its audit-trail capabilities provide an additional record of how ESG data moved through the reporting process.
The objective is simple:
Make every important number easier to trace, review and defend.
The number you want to hide may be the most useful one
This is where good reporting gets uncomfortable.
What happens when you miss a target?
Say so.
If emissions increased, explain why.
If safety incidents increased, explain what happened.
If employee attrition worsened, provide context.
If supplier assessments fell short of the target, explain the gap and what you are doing about it.
A report with no problems can raise more questions than it answers.
Investors understand that businesses have difficult years.
What they want to understand is whether management knows what went wrong.
And whether there is a credible response.
A useful structure is simple:
What happened?
Why did it happen?
What is management doing about it?
What should stakeholders expect next?
That is much more useful than hiding a miss under positive language.
Read your own BRSR like an investor
Before you file, run a simple test.
Open your last BRSR.
Go to Section C.
Pick the first important KPI you see.
Then ask:
Compared to what?
If the answer is "nothing," you have found a problem.
Now ask:
- Is there a prior-year figure?
- Is there a meaningful denominator?
- Is there a target?
- Is there a sector benchmark?
- Is the data source clear?
- Is the calculation methodology clear?
- Is the figure assessed or assured where applicable?
- Can someone understand whether performance improved or deteriorated?
If you cannot answer these questions quickly, an investor probably cannot either.
Then move to the next KPI.
Repeat the exercise.
You do not need to redesign your entire BRSR overnight.
Start with the numbers that matter most.
Improve the context around them.
Then move to the next.
The goal is not more BRSR data. It is better BRSR data.
Investors do not need another 100 pages of sustainability language.
They need information they can use.
They need to understand:
- What changed?
- Why did it change?
- How does the company compare?
- Is the company meeting its targets?
- Where are the risks?
- How reliable is the data?
- What is management doing next?
A BRSR that answers those questions becomes more than a compliance document.
It becomes part of the information investors use to understand the company.
That is the real opportunity.
Do not ask:
"Have we disclosed everything?"
Ask:
"Have we disclosed the things an investor needs to understand our performance and risk?"
That is a much higher standard.
And it is the standard worth aiming for.
Final Thought
Your BRSR does not need to say more.
It needs to tell investors more.
Give them numbers they can compare.
Give them trends they can follow.
Give them denominators that make sense.
Give them targets they can measure.
Give them context when performance changes.
And when something goes wrong, explain it.
Because a number without context is easy to ignore.
A number with context becomes a signal.
And signals are what investors are looking for.